Thursday, October 31, 2013

EURJPY short setup - strong momentum!

EURJPY has been coming down with strong momentum, and just went through clear support on 1H chart:


Now we have a retrace back to the level that's just been broken - that is: the entry point is here right now!

Probably looking for a profit target around 132.7 area and a Stop Loss width of ~30pips

Thursday, October 24, 2013

Waiting for a break on AUDUSD

Currently monitoring the Aussie as it approaches what still holds as major support. Using a 1H timeframe this is what we have now:


We will have to see a significant break downwards though, before justifying a short trade as the overall trend is still upwards.

Wednesday, October 23, 2013

USDJPY right now !


On the 5M chart as of this moment the USDJPY cross looks:


USDJPY 5M 13:00 GMT +1


A tradeplan for a Risk:Reward in the region of 1:3 to 1:5 could easily be set up here.

Just a quick live update for now


Monday, October 21, 2013

Strong potential in Australian VS. Dollar (AUDUSD)


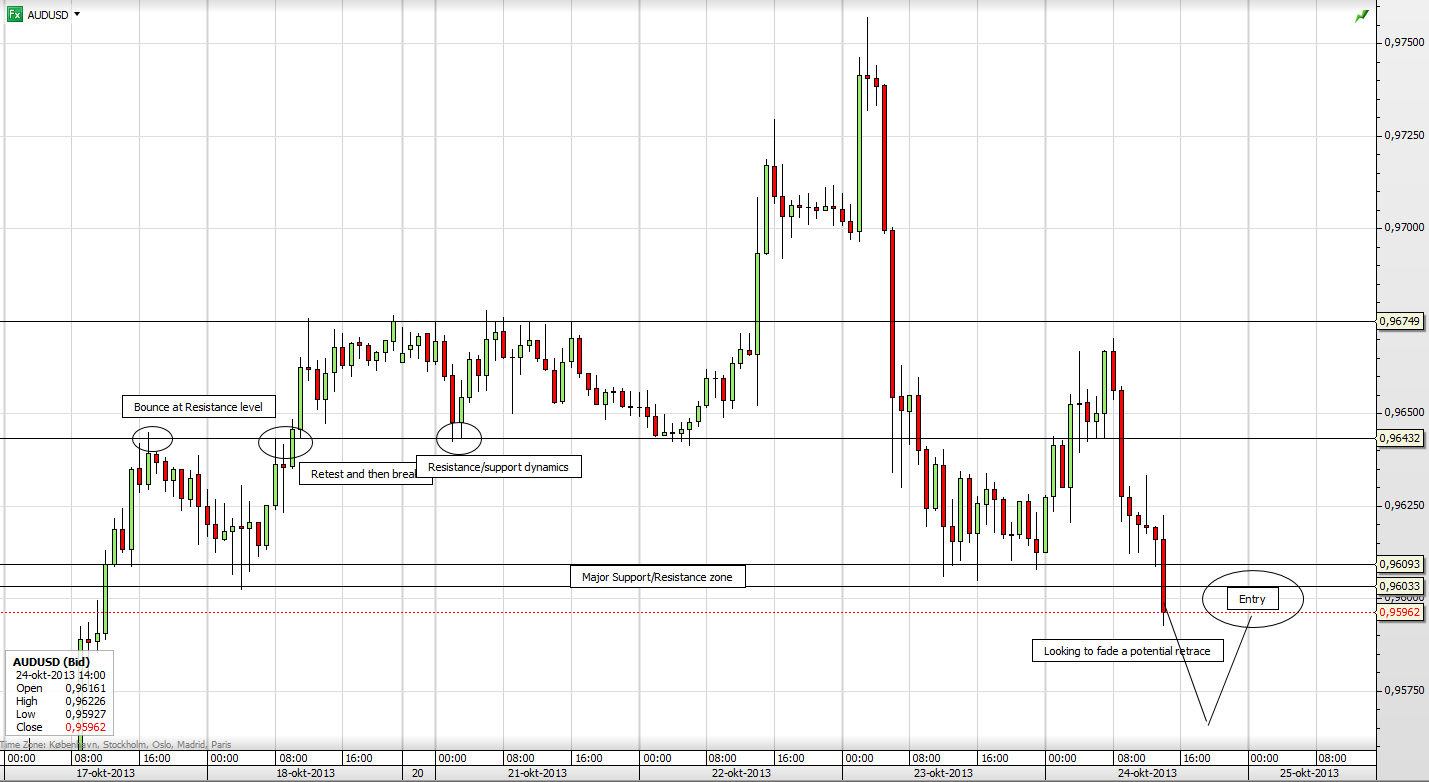
Currently looking at the Aussie versus the dollar. The pair has shown some significant correlations between price action and previous price action levels over the last period. For that reason alone one should be dedicated to this chart, and have a plan for taking advantage of the upcoming price development. Further on we are seeing a clean and strong uptrend which in itself enhances our odds as long as we look to go in the direction of the overall trend.

AUDUSD 15M 21st of october


At the current level of price action there has been multiple bounces back from resistance, which is not what we have seen earlier on in this trend. This might indicate partly that we could be seeing a weakening of momentum, for which we should keep an eye out. On the contrary we have a 0.9675 area which has seen massive testing and is now very well established. A possible break upwards would therefore present a very significant potential in that:

A) a continuation of the uptrend momentum could drive price far up further
B) the '75 level being as established as is the case, Risk:Reward will be very lucrative

So in conclusion the planned line of action herefrom: if a break occours, we will look to enter at a retrace to around the 0.9675 level.

Saturday, October 12, 2013

Things are still all new around here!

So this blog has been up for a few days, and content have started to come up online. The whole concept of running a blog will be all new for a long time to come. So the order of new posts and charts, and overall changes to the blog, will be somewhat random for now.

Any ideas, corrections or hello's will be much appreciated!

Thank you.

Friday, October 11, 2013

Forex thoughts and Forex fading

The following is a post which I originally published to the InformedTrades community in november'12


Currently taking some days away from futures charts - who wouldn't spend such time with forex charts?


A few good trades in the last days have made USD/CHF my current favourite cross. What I'm looking at is the dynamics of Support and Resistance levels - no indicators, all price action. I watch the 1H charts and manually mark up S/R levels and while doing so I make just a slight note in the back of my head on how strong each level seems to be. As the current trend is downwards I enter when there's a setup for fading PA going towards the latest Support zone.


I rarely ever mention Risk:Reward as I have always seen this as half the story - odds of positive outcome being the other half. With that said though, should one care to look at the numbers they will often be very favourable as the S/R levels are very well defined. For S/R levels I give almost no thought to spikes going outside of these, and base my levels entirely on closing prices - the 1H chart clearly justifies this as there's often one spike outside S/R level and 2-4 bounces(closing price) at the level.


The chart here has my latest trade plotted - FXCM in stardard setup only shows closed trades for the last 24H period. I closed the position due to the potential short term upwards momentum that could be caused by the double bottom. By the way the trade was closed around 8 pips from the bottom - as I was sleeping when that formed. The trade was closed at +18pips thus an "optimal" close would have made for ~50% more profit.


As you can see another setup might be under way, because the S-level I sold at has now been broken. Should this form a setup the important level would likely be the level marked up in orange in the right side.

Attached Thumbnails
  

Thursday, October 10, 2013

Looking at the ticks(S&P Futures)

The following is a post which I originally published to the InformedTrades community in march '12

It's been a while since I've done anything with this blog. Today however I want to share a look at the ticks. Why? For the purpose of education/thought sharing/inspiration - use it as you like. If some readers have never used the ticks or should confuse this with tick charts, I'm sure they can find lots of info here at IT.

First things first, here's how the Ticks looked on the 15th:

This image has been resized. Click this bar to view the full image. The original image is sized 640x271.


Vertical lines are set at +/- 600 values using a 1 minute chart. These levels are based on the recent tick volatility, which from my experience is relative low compared to other periods. The -600 value is reached 3 times at 10:01 am, 2:37pm and 2:54pm(chart has 15:01 - being GMT +1).

On a 1 minute chart this period formed as:

This image has been resized. Click this bar to view the full image. The original image is sized 800x436.


Notice how a clear reversal sets up at exactly 10:01 eastern. This is absolutely noteworthy and for two reasons. First the reversal in price actions correlates with the extreme tick reading of -600. Second the very bottom forms ~1 minute past 10:00am eastern - a very significant time of the day. I will not go into further explanation of this here, but only mention how the significance of this reversal time can easily be seen going through charts. 

After the 10am reversal a long uptrend leads through the day before market changes into a downtrend. Now when we study the correlation between the two charts we see that during the downtrend the ticks start to spike down until it hits the -600 reading just as it did in the morning. This time there is no abrupt shift in price right here, but notice how the trend changes shortly after. The very bottom of this downtrend is formed between the only two -600 readings. 

So looking at this particular time period in hindsight we see that we could (at the very least!) have gotten an indication that a trend reversal was likely coming up. Furthermore we see a correlation between the two major turning points of the day, being the -600 tick level. If this last correlation is valid in general of course cannot be determined from this single day and it is a point I have not been looking into. That might the topic of a future blog post including thoughts as to why a such would/would not be valid and explainable.

Changing the setting from the 15th to the 18th, I want to talk about a different setup. First a quick market recap to set a context for price action: A relatively strong upwards move over night loses momentum and then starts consolidating which is the part of price action shown in the chart:

This image has been resized. Click this bar to view the full image. The original image is sized 800x466.


The point of interest here is the second area marked in yellow. Technically this is the very signal that trend has become consolidation. Based on price action alone we see that the market will open in a consolidating market. Looking at the ticks again however will show a reading of almost -900 - a significant variation from it's prior range in +/-600 area. Afterwards the market quickly reverses up from this extreme tick reading.

Could the last example be interpreted differently? Yes definitely. For instance another perspective would be to focus on the market opening with a gap to the downside - arguing from gap theory that this would be the explanation more than tick readings. Furthermore a study of the validity of tick readings going into the open(versus intraday) might be worth itself.

Im my personal studies and trading, the time dedicated to ticks have been very limited. And for my active trading it's simply never used. Based on some of these recent observations however it's my impression that the ticks hold a strong potential in complimenting analysis of price action - thus the reason for this text.

Good Trading. Good studies.

S&P Futures Trading Plan

What follows is what used to be my trading for a long time trading the ES(S&P) Futures

Further explanations to come


Premarket:

-Mark start of regular session

-Notice news times

-Prior day HL

-Set the 3 charts(Ticks, 610, 1300)


Opening:

-Gap: which direction? quantify?

-Look at volume

-Look at swing volatility(pre and opening)

-Attention to 10:00 and 10:30


Trade execution:

-Minimize risk exposure(time)

-Move sL

-Don't forget orders


The market

-First hour tendencies?

-How much swing selection?

-Ticks/price correlation?


After market

-Log all trades

-Mutual aspects of the trades?

-Criticism on all trades

-Reflection on the day overall

Premarket:
As I don't trade in the premarket, I rarely watch much of the price action there but use some of the time for preparations. I notice news times as I want to avoid trading through these. I mark the start of the regular session on the chart, so that I can clearly differentiate between PA before and after the opening. I set up different charts to get both a longer and a shorter perspective. Lastly I mark the high and the low from the preceding day, more specifically those from the regular session. When I get this done before the open I can simply focus on the actual trading with less interruptions when I'm in the market.

Wednesday, October 9, 2013

Supply and demand forex trading

For the most recent period of my trading, my focus has been strictly at the forex markets. Therefore it seems meaningfull to make that the topic of writing for now.


Planned points for this post:


  • Strategy
  • Routine
  • Actual results
  • Discussion of results
  • Where am I now?


This blog is up running!

I have been meaning to start a blog for a long time. Today came somekind of a breakthrough in my thought process. Not that I saw suddenly how everything could be done in the most optimal way or anything like that. On the contrary, I guess I realized that as nothing will ever be perfect I might as well start writing today - call it cliché, but it made for the start of this blog.

If I was to take a guess for now, I would say that the topic of things not going to ever be just perfect, will soon come back around as its relation to trading is just so very clear.

Ending in those words, my very first post :)